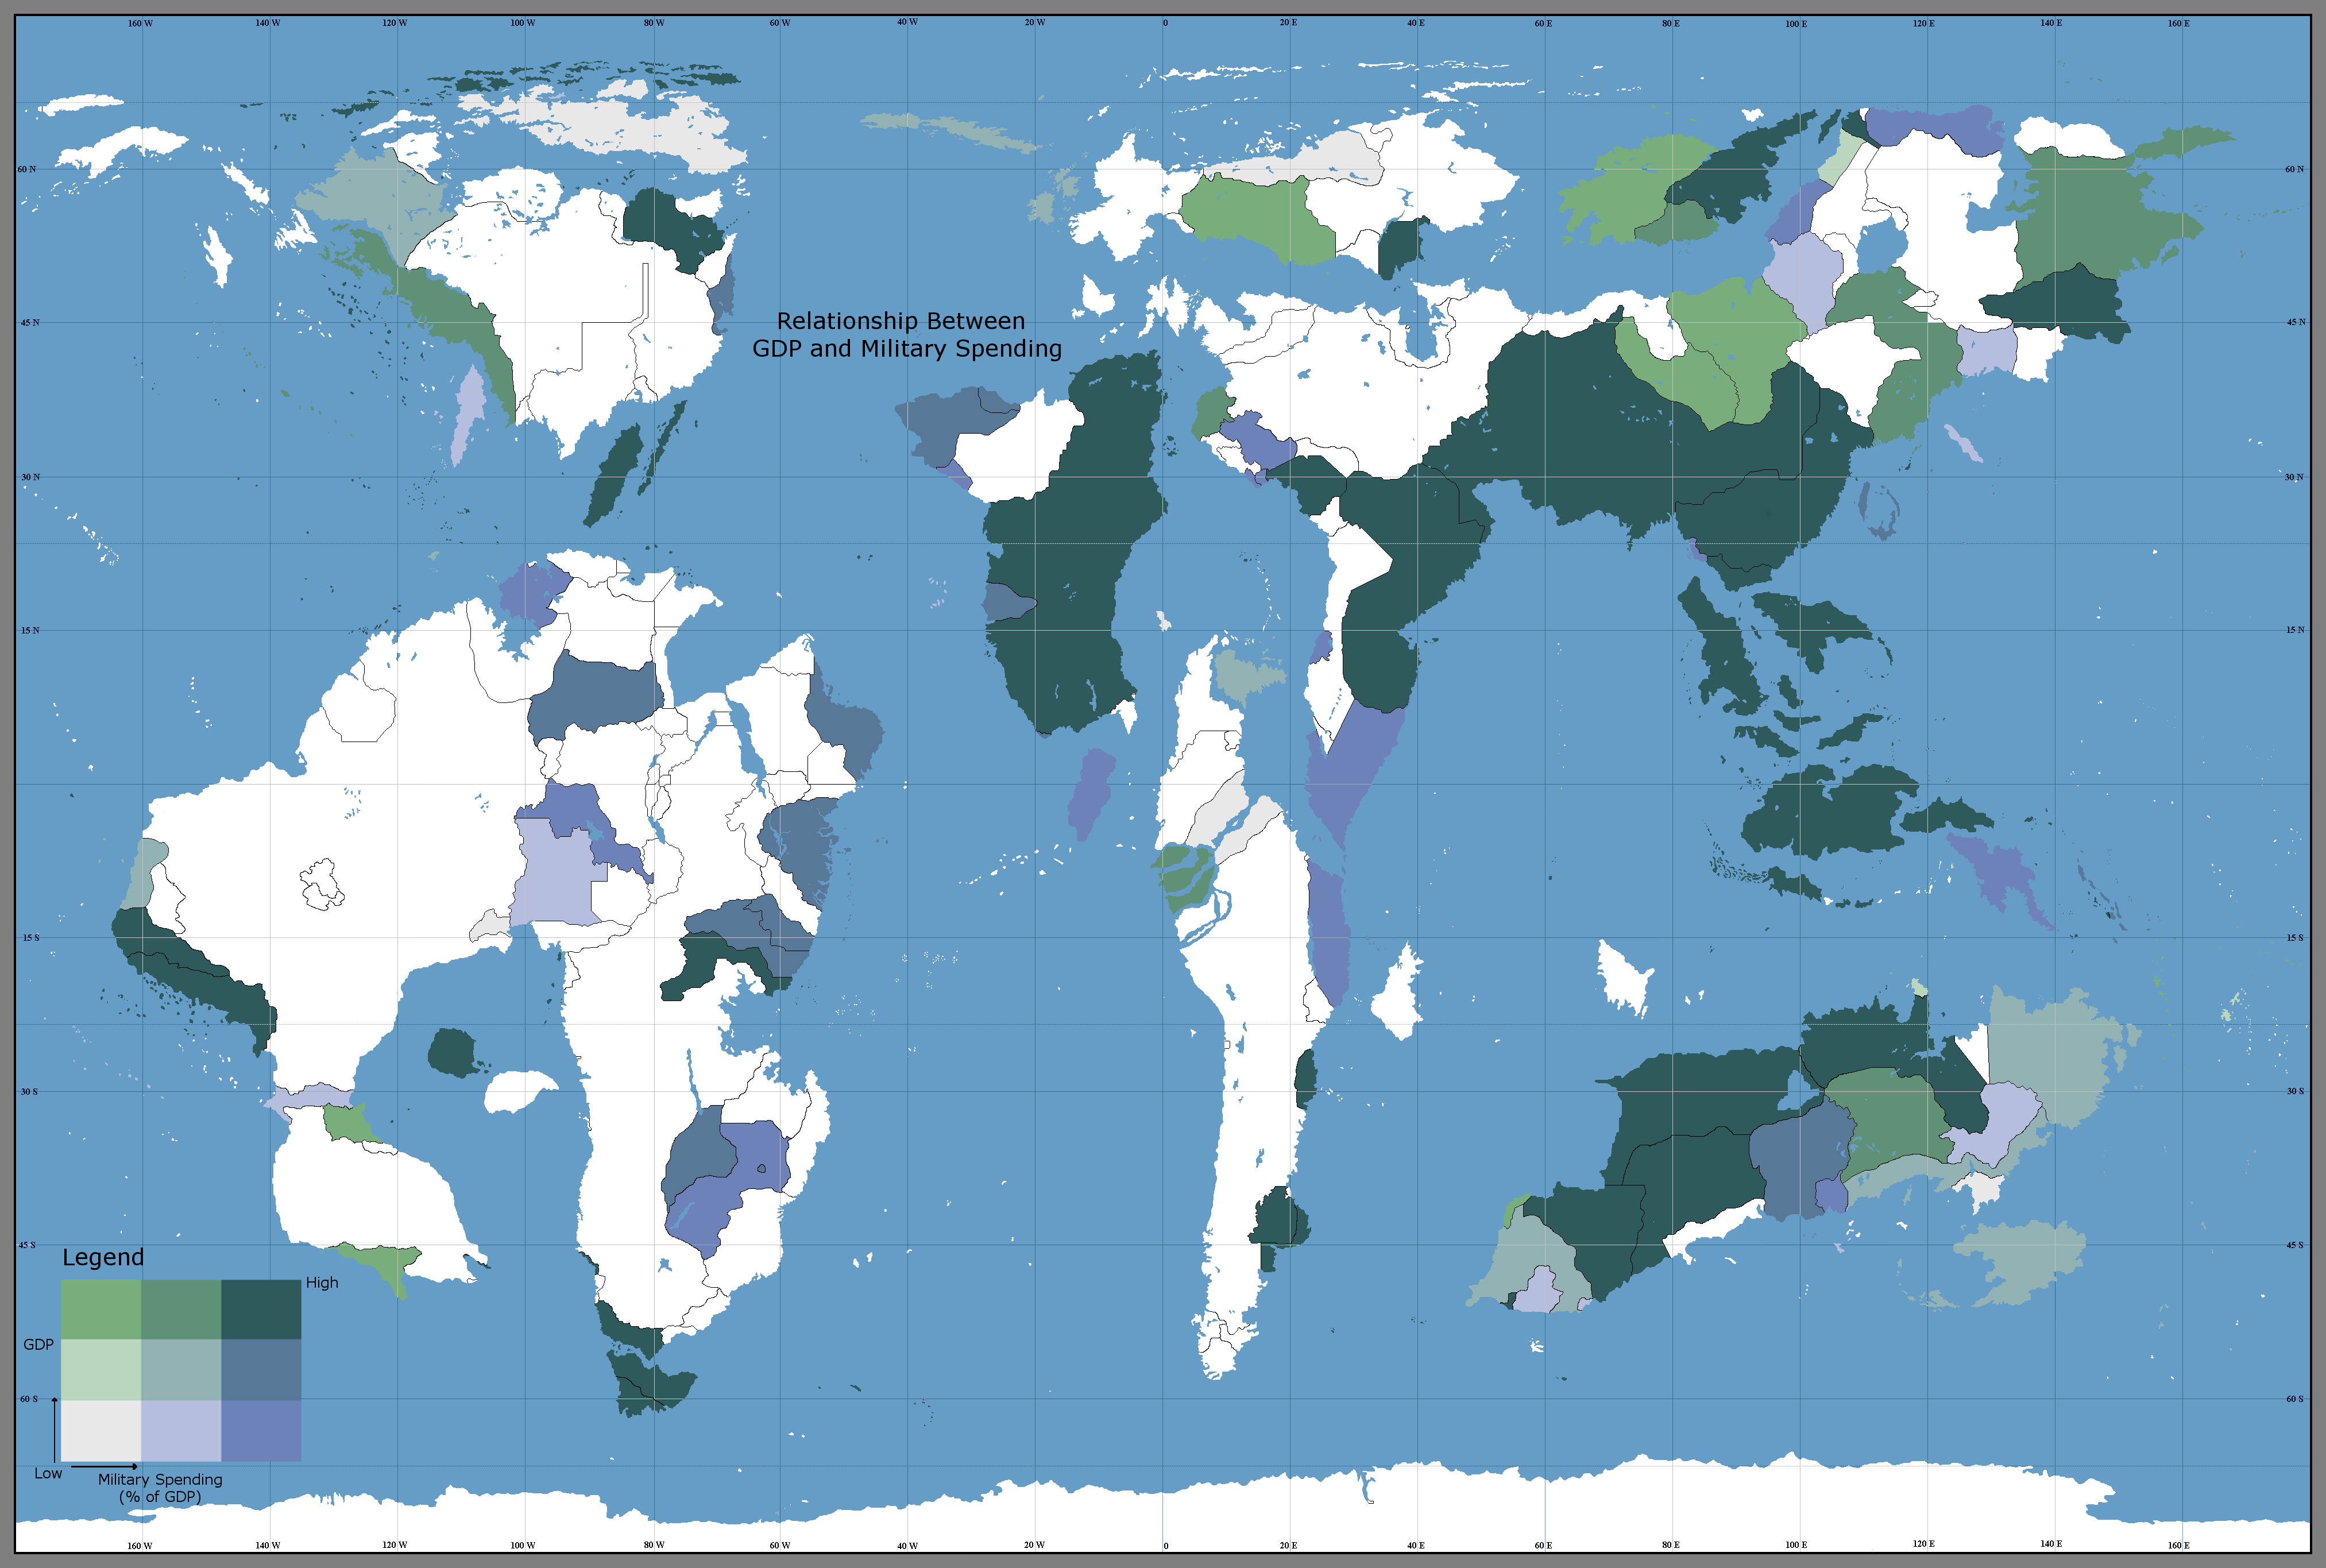
I wanted to see what the spatial component of the relationship between National GDP and Military Spending was, so I made a map depicting the relationship for the nations:
To read the legend on the map, start in the bottom left corner, and if you move up the y-axis, the nation’s GDP gets higher.
Moving to the right along the x-axis means the military spending as a percentage of GDP gets higher. So, nations that have a high GDP and low military spending will be light green, while nations with low GDP but high military spending will be light blue, and nations with both being high will be a combination will be a mix of dark green and blue.
Some thoughts:
Contrary to what I originally thought, the richest continent is Yasteria, especially southeast Yasteria.
The most diverse continent in terms of GDP and military spending is Aurora, with nations filling every category.
The most militarized continent is Gondwana, especially eastern Gondwana. I’m surprised there has not been as much military RPs going on there.
Many of our world conflict RPs have been in nations considered high in military spending but relatively low in GDP.
There exists some form of clustering with regard to similar stats, as nations near each other tend to be in the same category, or close to a neighboring nation’s category.
Going into detail about this phenomenon, there appears to be a positive spatial relationship with the amount of military spending as a percentage of GDP for each country. This means that countries near each other tend to spend similar percentages on their military, which, in international relations and security studies, is indicative of a realism philosophy of accumulating military power to match neighbor production.
If your nation is not colored in, it means that the cartographic study has not been filled in, and therefore, I do not have your nation information. I would be happy to add it to the map (more data=more analysis), so please let me know if you would like me to put that information up!
I’ll probably look at what other nation stats I can map, and I will post them here. Let me know if you have any suggestions!
Furni[edit_reason]More countries added 9/29[/edit_reason]